

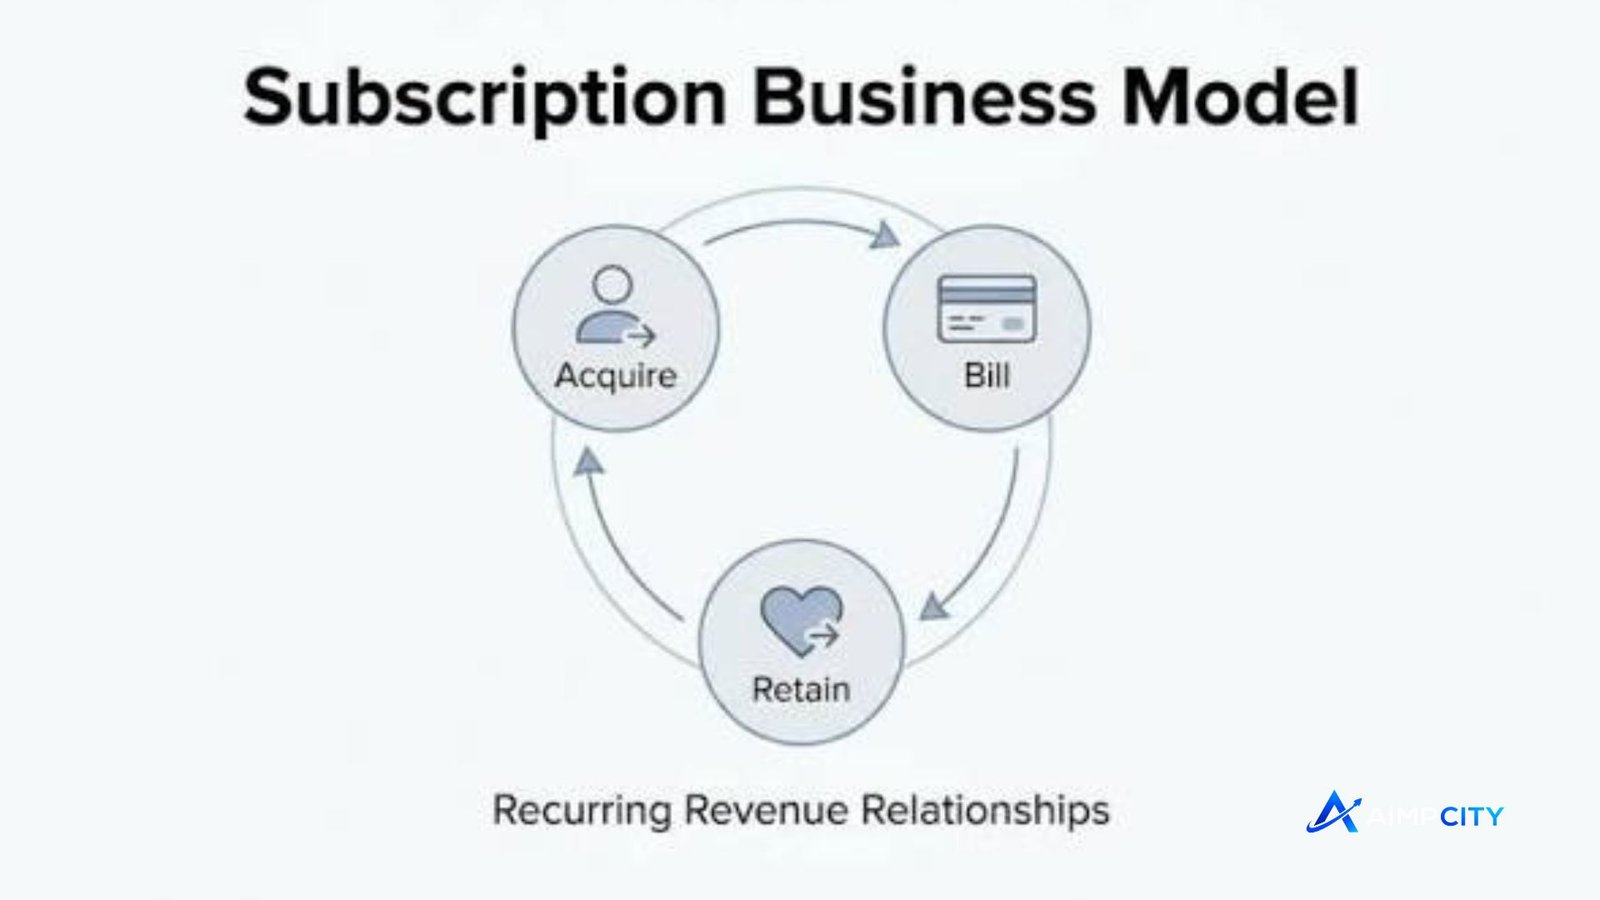
Subscription business model metrics help companies understand whether recurring revenue is growing, customers are staying, and acquisition spending is producing enough long-term value. Unlike one-time sales, subscriptions depend on what happens after the initial purchase: renewals, upgrades, cancellations, usage, and payment performance.
For SaaS companies, membership businesses, media services, subscription boxes, and other recurring-revenue companies, the right measurements turn billing data into practical decisions. The goal is not to track every number available, but to identify the metrics that explain growth, retention, and unit economics.
Why subscription business model metrics matter
A subscription company can report rising sales while still developing a weak underlying business. New customers may be masking high churn, or revenue growth may be coming at an unsustainably high acquisition cost.
That is why subscription business model metrics should be viewed together. MRR shows recurring revenue momentum, churn exposes customer losses, and LTV and CAC reveal whether growth economics make sense.
Stripe identifies MRR, ARR, churn, expansion and contraction, NRR, LTV, and CAC among the important measures for subscription revenue forecasting.
The 10 subscription business model metrics to track
1. Monthly Recurring Revenue (MRR)
MRR represents the monthly recurring revenue a business expects from active subscriptions. It is useful for monitoring revenue trends without the noise of one-off transactions. Stripe notes that MRR is a performance measure rather than GAAP revenue.
Track MRR by source where possible, separating new business, expansion, contraction, reactivation, and churn. That breakdown explains why recurring revenue changed rather than simply showing that it changed.
2. Annual Recurring Revenue (ARR)
ARR provides a longer-term view of recurring revenue and is commonly calculated as MRR multiplied by 12. It can make annual planning and reporting easier, particularly for businesses with recurring contracts.
ARR should not be treated as guaranteed future revenue. Customers can cancel, downgrade, or fail to renew, so retention metrics need to accompany it.
3. Customer Churn Rate
Customer churn measures the percentage of customers who stop paying during a defined period. For example, if 1,000 customers begin a month and 50 cancel, the period’s customer churn is 5%, assuming the calculation uses the starting customer base.
Churn deserves close attention because every lost subscriber creates pressure to replace that revenue through additional acquisition. It can also reduce expected customer lifetime value.
4. Revenue Churn
Customer churn and revenue churn are not interchangeable. Revenue churn measures recurring revenue lost through cancellations or reductions in customer spending.
Consider two businesses that each lose 10 customers. If one loses ten small accounts and the other loses two major accounts plus eight small ones, their customer churn could look similar while the financial impact differs substantially.
5. Net Revenue Retention (NRR)
NRR measures how recurring revenue from an existing customer group changes after accounting for expansion, contraction, and churn.
A business starting with $100,000 of recurring revenue from an existing cohort and ending with $110,000 from that same cohort has 110% NRR. An NRR above 100% means expansion from existing customers has exceeded revenue lost from that group.
6. Customer Acquisition Cost (CAC)
CAC measures the cost of acquiring a customer, including relevant sales and marketing expenses. Tracking it by acquisition channel can reveal whether certain sources produce customers at materially different costs.
A rising CAC is not automatically a problem, but it becomes concerning when customer value and retention do not increase enough to support the additional spending.
7. Customer Lifetime Value (LTV)
LTV estimates the revenue a customer generates during the relationship with a company. A simple subscription calculation can use average revenue per customer multiplied by expected customer lifespan, although businesses may use more sophisticated models.
Because LTV is predictive, treat it as an estimate rather than a guaranteed amount. Recalculate it as customer behavior changes.
8. LTV-to-CAC Ratio
Comparing LTV with CAC connects customer economics to acquisition spending. For example, a customer with an estimated $1,500 LTV and $500 CAC produces an LTV-to-CAC ratio of 3:1.
The ratio is most useful alongside retention, gross margin, and payback period. A seemingly attractive LTV can be misleading if it is based on optimistic lifespan assumptions.
9. Average Revenue Per User (ARPU)
ARPU shows the average revenue generated per user or customer over a defined period. It can reveal changes in pricing, plan mix, upgrades, and customer composition.
For example, a subscription company may have stable customer numbers but rising ARPU because more customers are adopting higher-priced plans. Segmenting ARPU by plan or market can make these changes easier to understand.
10. Customer Retention and Engagement
Retention tells you who stays; engagement can help explain why. Depending on the product, useful engagement indicators might include active days, feature usage, content consumption, or successful product actions.
For usage-based subscriptions, usage data can be especially relevant because customer behavior may directly influence revenue.
| Metric | What it measures | Primary business question |
|---|---|---|
| MRR | Recurring monthly revenue | Is recurring revenue growing? |
| ARR | Annualized recurring revenue | What is the longer-term revenue base? |
| Customer churn | Customers lost | Are subscribers staying? |
| Revenue churn | Recurring revenue lost | How financially significant is churn? |
| NRR | Existing-customer revenue change | Are existing accounts expanding? |
| CAC | Acquisition cost | What does it cost to win a customer? |
| LTV | Expected customer value | How much value can customers generate? |
| LTV:CAC | Customer value versus acquisition cost | Do acquisition economics make sense? |
| ARPU | Average revenue per customer | How much revenue does each customer generate? |
| Engagement | Product or service usage | Are customers receiving ongoing value? |
💡 Pro Tip: Build a monthly metric dashboard with the same definitions every period. Changing the churn denominator or LTV formula from month to month can make trends appear better or worse simply because the calculation changed.
How to use the metrics together
The most useful subscription business model metrics form a connected picture rather than a collection of isolated KPIs.
Start with MRR and ARR to understand recurring revenue. Then examine customer and revenue churn to identify losses. NRR shows whether existing accounts are expanding enough to offset contraction and churn. Finally, compare CAC with LTV and monitor the time required to recover acquisition costs.
For example, rising MRR combined with worsening churn may indicate that acquisition is compensating for retention problems. Conversely, moderate new-customer growth alongside strong retention and expansion can produce a very different revenue trajectory.
Segmentation also matters. Review metrics by customer cohort, acquisition channel, pricing plan, geography, and customer type where the data supports it. Aggregate figures can hide important differences between profitable and unprofitable customer groups.
Common mistakes when measuring subscription performance
One frequent mistake is focusing almost entirely on revenue. Recurring revenue is important, but it does not explain whether growth is efficient or durable.
Another is mixing customer churn with revenue churn. Both are useful, but they answer different questions.
Businesses can also overtrust LTV. Since LTV relies on assumptions about retention and future behavior, it should be checked against actual cohort performance. Stripe likewise describes LTV as a predictive metric that should be recalculated periodically.
Finally, avoid creating dozens of KPIs without assigning decisions to them. A metric becomes useful when a change in that metric tells a team what deserves investigation or action.
📌 Key Takeaway: The strongest subscription dashboards connect revenue, retention, acquisition, and customer economics. MRR alone can show growth, but churn, NRR, LTV, CAC, and engagement explain whether that growth is sustainable.
Frequently Asked Questions
What are the most important subscription metrics?
The core measures usually include MRR, ARR, customer churn, revenue churn, NRR, CAC, LTV, ARPU, and engagement. The right combination depends on the pricing model and customer journey. A usage-based business may need more behavioral metrics, while an annual-contract business may place greater emphasis on renewal and expansion.
How do you calculate subscription churn?
Customer churn is commonly calculated by dividing customers lost during a period by the starting customer count for that period. Revenue churn uses recurring revenue lost instead. Businesses should define the period and calculation method consistently so that comparisons remain meaningful.
What is a good LTV-to-CAC ratio?
There is no universal ratio that fits every subscription company. Interpretation depends on gross margin, growth rate, retention, sales cycle, customer segment, and how LTV is calculated. A ratio should therefore be examined with payback period and cohort performance rather than treated as a standalone pass-or-fail benchmark.
Why is NRR important for subscription businesses?
NRR shows what happens to revenue from existing customers after expansion, contraction, and churn. It helps distinguish growth driven by new customers from growth generated within the existing customer base. This makes it particularly useful for understanding account expansion and retention dynamics.
Which metrics should a new subscription business track first?
A young business can start with MRR, customer count, customer churn, revenue churn, CAC, and ARPU. As sufficient customer history develops, LTV and cohort retention become more informative. The dashboard should expand only when additional metrics support real business decisions.
Conclusion
Effective subscription business model metrics should explain the mechanics behind recurring revenue, not simply decorate a dashboard. MRR and ARR reveal revenue movement; churn and NRR expose retention; CAC and LTV show customer economics; and engagement metrics provide behavioral context.
The best measurement system is consistent, segmented, and tied to decisions. By reviewing these subscription business model metrics together, companies can see where revenue is coming from, where customers are being lost, and which parts of the model deserve closer attention.
